| Heat Gain
|
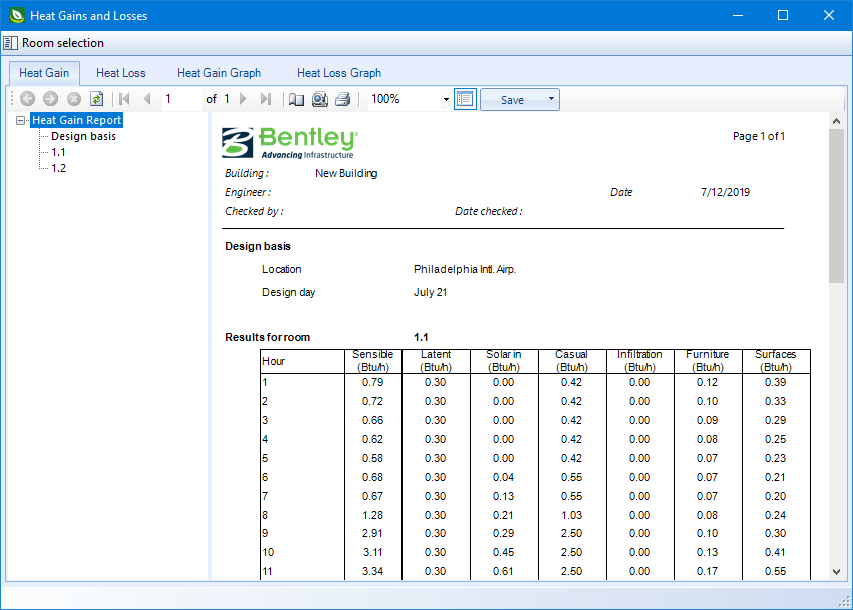
Lists the heat gain in a day for each hour.
|
| Heat Loss
|
Lists the heat gain in a day for each hour. The loss is indicated
with a minus sign.
|
| Heat Gain / Heat Loss Graph
|
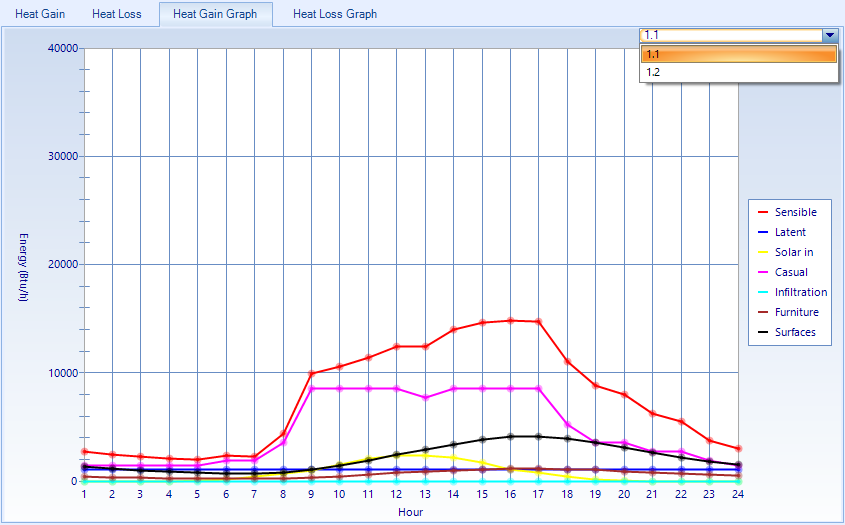
Contains controls used to view a graphical report of the
simulation heat gains and losses results. Select a room from the list to update
the graph.
The heat gains graphs for selected room can be displayed. The
total heat gain and individual component gains: sensible, latent, solar in,
casual, infiltration, furniture, and surfaces are shown as different colored
curves.
- Energy gain - The
heat gain values are displayed on the graph's vertical (Y) axis. The scale is
automatically adjusted when viewing smaller or larger values making it easier
to distinguish the separate graph curves.
- Time - The 24 hours
of the design day are displayed on the graph's horizontal (X) axis.
- Curves - Load
components that make up the heat gains for the selected room or project are
displayed with color coded curves. The color codes are described in the graph
legend. The curves and legend are interactive, providing you with pop up help
windows.
|